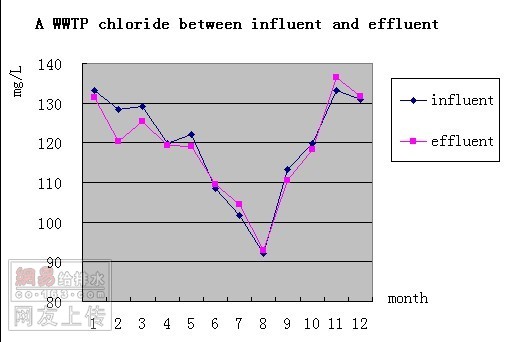
最近在一座污水处理厂发现进出水的氯化物相差很大,而其他几座污水处理厂没有这种现象,请教各位如何解释?Image B is the chloride curve of the wastewater treatment plant. Image A is another plant. All the data is month average value and sample are 24h sample.
Image B is the chloride curve of the wastewater treatment plant. Image A is another plant. All the data is month average value and sample are 24h sample.


